Notebooks
Taiao Case 4

Description:
-
Metadata:
Author:
N/A
Licenses:
None
Datasets:
Content:
We load the required libraries used to train the LSTM
import tensorflow as tf
import tensorflow.keras as keras
import tensorflow.keras.backend as K
from tensorflow.keras.layers import LSTM
from tensorflow.keras.layers import Dense
from tensorflow.keras.preprocessing.sequence import TimeseriesGenerator
import pandas as pd
import numpy as np
import matplotlib.pyplot as pyplot
The flood prediction dataset has been encapsulated in the packages below and can be loaded using the code below
import taiao.dataset.river as data
import taiao.visualization.river as visualiser
import taiao.model.river as models
pd.DataFrame(xTrain).tail()
We set the hyper-parameters and load the dataset and create the keras data generator
forecast=12
lookback=288
xTrain = data.x('train',forecast)
yTrain = data.y('train',forecast)
xTest = data.x('test',forecast)
yTest = data.y('test',forecast)
trainGen=TimeseriesGenerator(xTrain,yTrain,length=lookback,batch_size=3)
testGen=TimeseriesGenerator(xTest,yTest,length=lookback,batch_size=1)

featureCount=xTrain.shape[1]
depth=2
Here we define the model and train the output
model = models.LSTM(depth,featureCount,lookback, optimizer="adam")
history = model.fit(trainGen,validation_data=testGen, epochs=1).history
model.save('3DLookBack_3hr_forecast_rmse')
134315/134322 [============================>.] - ETA: 0s - loss: 0.0027
We now evaluate the model
model.evaluate(testGen)
trainPredict = model.predict(trainGen)
testPredict = model.predict(testGen)
172522/172522 [==============================] - 469s 3ms/step - loss: 9.9911e-04
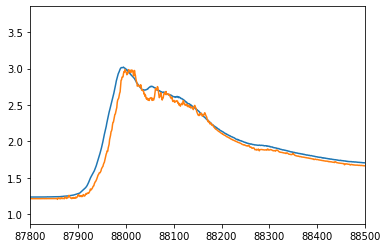
and plot the output for the flood event of interest
pyplot.plot(yTest[lookback:])
pyplot.plot(testPredict)
pyplot.xlim((87800,88500))
pyplot.show(block=False)
We do a dump of the csv file comparing the predicted river level to the actual river level
CsvTemp=np.concatenate([yTest[lookback:].reshape(-1,1),testPredict],axis=1)
np.savetxt('3D_Prediction_3hr_rmse.csv',CsvTemp,delimiter=',')
