Notebooks
MetOcean Solutions Observation API connector
Description:
This notebook describes how to get observation data from one of MetOcean Solutions' observation API. The data that can be accessed though the API come from different sources such as MetService's automatic weather station network, a number of wave buoys and tidal gages owned by various organisations. Different instances of the API are used for different sources. This connector should work for all of them. The API provides the data as sets of records that belong to a station. Each station is identified by a unique id string. Each station has its own metadata describing location, instrument, ownership, status, license and level of permission. If the station is not open then anyone interested to use the data needs to get in contact with MetOcean to negotiate access to the data. Any access to data non data will be done using the same connector but authentication will need to be set when initialising the connector. For now the connector allows to retrieve data in the shape of xarray datasets. A complete documentation of the API can be found here: https://observations-open.metoceanapi.com/api/swagger/
Metadata:
Ocean
Sebastien Delaux
To Be Determined
Datasets:
Content:
Installation of required libraries
Install and import xarray and matplotlib in the current Jupyter kernel. Xarray is a great library to work with data stored using NetCDF format. MetOcean's Observation API can provide data under the form of netCDF-like JSON and hence xarray is a great option to work with that data. Matplotlib will used to plot the data.
In [1]:
import sys
!{sys.executable} -m pip install xarray matplotlib
import xarray
Collecting xarray
  Using cached https://files.pythonhosted.org/packages/ee/11/fb2a8a6015e3de4ff19a4870bb0d11f48ebdd997062557d24cd076b3088f/xarray-0.15.1-py3-none-any.whl
Collecting matplotlib
  Using cached https://files.pythonhosted.org/packages/93/4b/52da6b1523d5139d04e02d9e26ceda6146b48f2a4e5d2abfdf1c7bac8c40/matplotlib-3.2.1-cp36-cp36m-manylinux1_x86_64.whl
Collecting numpy>=1.15 (from xarray)
  Using cached https://files.pythonhosted.org/packages/07/08/a549ba8b061005bb629b76adc000f3caaaf881028b963c2e18f811c6edc1/numpy-1.18.2-cp36-cp36m-manylinux1_x86_64.whl
Collecting setuptools>=41.2 (from xarray)
  Using cached https://files.pythonhosted.org/packages/a0/df/635cdb901ee4a8a42ec68e480c49f85f4c59e8816effbf57d9e6ee8b3588/setuptools-46.1.3-py3-none-any.whl
Collecting pandas>=0.25 (from xarray)
  Using cached https://files.pythonhosted.org/packages/bb/71/8f53bdbcbc67c912b888b40def255767e475402e9df64050019149b1a943/pandas-1.0.3-cp36-cp36m-manylinux1_x86_64.whl
Collecting python-dateutil>=2.1 (from matplotlib)
  Using cached https://files.pythonhosted.org/packages/d4/70/d60450c3dd48ef87586924207ae8907090de0b306af2bce5d134d78615cb/python_dateutil-2.8.1-py2.py3-none-any.whl
Collecting kiwisolver>=1.0.1 (from matplotlib)
  Using cached https://files.pythonhosted.org/packages/f8/a1/5742b56282449b1c0968197f63eae486eca2c35dcd334bab75ad524e0de1/kiwisolver-1.1.0-cp36-cp36m-manylinux1_x86_64.whl
Collecting pyparsing!=2.0.4,!=2.1.2,!=2.1.6,>=2.0.1 (from matplotlib)
  Using cached https://files.pythonhosted.org/packages/5d/bc/1e58593167fade7b544bfe9502a26dc860940a79ab306e651e7f13be68c2/pyparsing-2.4.6-py2.py3-none-any.whl
Collecting cycler>=0.10 (from matplotlib)
  Using cached https://files.pythonhosted.org/packages/f7/d2/e07d3ebb2bd7af696440ce7e754c59dd546ffe1bbe732c8ab68b9c834e61/cycler-0.10.0-py2.py3-none-any.whl
Collecting pytz>=2017.2 (from pandas>=0.25->xarray)
  Using cached https://files.pythonhosted.org/packages/e7/f9/f0b53f88060247251bf481fa6ea62cd0d25bf1b11a87888e53ce5b7c8ad2/pytz-2019.3-py2.py3-none-any.whl
Collecting six>=1.5 (from python-dateutil>=2.1->matplotlib)
  Using cached https://files.pythonhosted.org/packages/65/eb/1f97cb97bfc2390a276969c6fae16075da282f5058082d4cb10c6c5c1dba/six-1.14.0-py2.py3-none-any.whl
Installing collected packages: numpy, setuptools, pytz, six, python-dateutil, pandas, xarray, kiwisolver, pyparsing, cycler, matplotlib
Successfully installed cycler-0.10.0 kiwisolver-1.1.0 matplotlib-3.2.1 numpy-1.18.2 pandas-1.0.3 pyparsing-2.4.6 python-dateutil-2.8.1 pytz-2019.3 setuptools-46.1.3 six-1.14.0 xarray-0.15.1
Install and import cf-json extension to xarray which will be used to turn netCDF-like json as returned by the API into an xarray Dataset
In [2]:
!{sys.executable} -m pip install git+ssh://git@github.com/metocean/cf-json@v0.3.3
from cfjson.xrdataset import CFJSONinterface
Collecting git+ssh://git@github.com/metocean/cf-json@v0.3.3
  Cloning ssh://git@github.com/metocean/cf-json (to v0.3.3) to /tmp/pip-ne5mykz6-build
Installing collected packages: cfjson
  Running setup.py install for cfjson ... done
Successfully installed cfjson-0.3.3
Import request library to query the API and path module of os package to help building url
In [3]:
import requests
from os import path
Definition of connector
Declare a new exception class that can be used to identify any exception raised by the connector
In [4]:
class MetOceanObsAPIException(Exception):
    def __init__(self, message, obj=None, obj_name=None, status=400):
        self.message = message
        self.obj = obj
        self.obj_name = obj_name
        self.status = status
        super(ThreddsServerConnector, self).__init__(message)
Definition of connector
In [5]:
class MetOceanObsAPIConnector(object):
    """
    A class used to connect one of MetOcean Solution's instances
    of their observation API.

    Attributes
    ----------
    root_url : str
        The root url of the service

    Methods
    -------
    get_station_metadata(station_id)
        return the metadata associated with a given observation station
    get_data()
        return observation data retrieved from the API in the form of a xarray dataset object
    """

    def __init__(self,
                 root_url="https://observations-open.metoceanapi.com",
                 username=None, password=None, api_key=None):
        """
        Initialise the connector

        Parameters
        ----------
        root_url : str
            The url of the observation API to connect to. (default is https://observations-open.metoceanapi.com)
        username : str
            The username to use to connect the API
        password : str
            The password to use to connect the API
        api_key : str
            The api_key to use to connect the API

        Raises
        ------
        NotImplementedError
            If any of the authentication parameters is set.
        """

        self.root_url = path.join(root_url, 'api/stations')

        if username or password or api_key:
            raise NotImplementedError("Secure authentication is yet to be implemented for the connector")


    def get_station_metadata(self, station_id):
        """
        Get the metadata associated with a given observation station

        Parameters
        ----------
        station_id : str
            The id of the station to return the metadata for.

        Raises
        ------
        MetOceanObsAPIException
            If query did not return with 200 status code

        Returns
        -------
        dict
            A dictionary containing the metadata associated with the station

        """

        ## Build query url
        url = path.join(self.root_url,
                        station_id)

        ## Do request
        res = requests.get(url)

        ## Check request successed. If not raise exception
        if res.status_code != 200:
            raise MetOceanObsAPIException("getstation_metadata query failed with status code {1} and reasons: %s"\
                                          .format(res.status_code,\
                                                  res.text))

        ## Decode JSON response and return
        return res.json()

    def get_data(self,
                 station_id,
                 time=None,
                 variables=None,
                 max_nrecords=100):
        """
        Get the metadata associated with a given observation station

        Parameters
        ----------
        station_id : str
            The id of the station to return the metadata for.
        time : str
            ISO8601 time interval with double dash option and empty start/end allowed
            used to filter the data. Valid exemples are:
                time=2007-03-01T13:00:00Z--2008-05-11T15:30:00Z
                time=2007-03-01T13:00:00Z--
                time=--2008-05-11T15:30:00Z
        variables : list
            List of strings containing the name of the variables to retrieve.
            Return all by default
        max_nrecords : int
            The maximum number of records to retrieve (default is 100)

        Raises
        ------
        MetOceanObsAPIException
            If query did not return with 200 status code

        Returns
        -------
        xarray dataset
            A xarray dataset containing the data for the station

        """

        ## Build full url to query records
        url = path.join(self.root_url,
                        station_id,
                        'records')

        ## Build dictionary with query parameters
        params = {}
        params['time'] = time
        params['vars'] = variables
        params['limit'] = max_nrecords

        ## Excecute request
        res = requests.get(url,
                           headers={'accept': 'application/vnd.metocean.cf+json'},
                           params=params)

        ## Check for success
        if res.status_code != 200:
            raise MetOceanObsAPIException("Get data query failed with status code {1} and reasons: %s"\
                                          .format(res.status_code,\
                                                  res.text))

        ## Turn data into xarray dataset
        dset = xarray.Dataset()
        dset.cfjson.from_json(res.json())

        ## Return xarray dataset
        return dset
Instantiate new connector and retrieve metadata for the station of id 'ciwrb'
In [6]:
obs_api_connector = MetOceanObsAPIConnector()

metadata = obs_api_connector.get_station_metadata(station_id='ciwrb')

print(metadata)
{'id': 'ciwrb', 'name': 'ciwrb', 'tags': ['wave'], 'description': '', 'provider': 'metocean', 'level': 0.0, 'dataset': 'socean', 'coordinates': 'POINT (169.04916 -52.76000000000001)', 'latitude': -52.76000000000001, 'longitude': 169.04915999999997, 'public': True, 'is_active': False, 'last_record_at': '2019-06-19T18:00:00Z'}
For now the metadata available is limited and some metadata like the variables provided for a given station are not available. That information can be retrieved by first querying for a sample of the data.
In [7]:
dset = obs_api_connector.get_data(station_id='ciwrb',
                                  max_nrecords=3)
From the sample result, the names of the variables can be listed:
In [8]:
for (var_name, var) in dset.data_vars.items():
    print(var.attrs['standard_name'],'-->', var_name)
latitude --> latitude
longitude --> longitude
altitude --> level
sea_surface_wave_period_at_variance_spectral_density_maximum --> tp
sea_surface_wave_significant_height --> hs
sea_surface_wave_maximum_height --> hmax
sea_surface_wave_from_direction_at_variance_spectral_density_maximum --> dpm
Now we can query for specific variables only and a set time range
In [9]:
dset = obs_api_connector.get_data(station_id='ciwrb',
                                  time='2019-06-18T15:00:00Z--2019-06-19T21:00:00Z',
                                  variables=['hs', 'tp'],
                                  max_nrecords=300)
print("Retrieved {0} records for station ciwrb".format(len(dset.time)))
Retrieved 9 records for station ciwrb
Now we can do the same for a weather station. We retrieve temperature (tmp) since 2020-01-21 19:00:00Z and we get at most 200 records
In [10]:
dset = obs_api_connector.get_data(station_id='tu0fknyk',
                                  time=['2020-01-21 19:00:00Z--'],
                                  max_nrecords=200)

print("Retrieved {0} records for station tu0fknyk".format(len(dset.time)))
Retrieved 200 records for station tu0fknyk
Now lets plot the data using matplotlib
In [11]:
%matplotlib inline
import matplotlib.pyplot as plt
from matplotlib.dates import date2num

plt.xlabel('time')
plt.ylabel('Temperature (degree Celcius)')
plt.plot_date(date2num(dset.time), dset.tmp.data)
Out[11]:
[<matplotlib.lines.Line2D at 0x14c3179fb2e8>]


Simple numerical data correction example
Now we are going to put together a toy example aiming at correcting numerical data using observation data. That kind of approach could be used in the context of statistical downscaling.
Note that this is a toy example aimed at demonstrating a workflow and one added constraint for the demonstration was that it had to use a neural network model.
The amount of data used here is tiny and clearly not enough to build something scientifically robust. Also the model is only suitable in that it is aimed at working on sequences of data, we did not investigate scientific suitability and it is likely there are simpler and more suitable options.
The data used here is the 2 metres temperature from the nowcast for the last 9 days from the 0.25 degree GFS model at the same location as that of the observation station tu0fknyk.
In [12]:
from datetime import datetime
from dateutil.relativedelta import relativedelta
import numpy as np
Here is a useful function that converts the datetime format used by xarray to the "standard" python datetimes.
In [13]:
def datetime64_to_datetime(dd):
    return datetime.utcfromtimestamp(round(dd.data.astype(int) * 1e-9))
Get the longitude/latitude coordinates of the observation point
In [14]:
lon0 = dset.longitude.data[0]
lat0 = dset.latitude.data[0]
Now load one of the GFS dataset to identify the nearest grid point to the observation station
In [76]:
now = datetime.utcnow()
gfs = xarray.open_dataset('https://nomads.ncep.noaa.gov:9090/dods/gfs_0p25_1hr/gfs%04d%02d%02d/gfs_0p25_1hr_00z'%(now.year, now.month, now.day))
In [77]:
ilon = np.argmin(np.abs(gfs.lon.data-lon0))
ilat = np.argmin(np.abs(gfs.lat.data-lat0))
print("Approximating longitude",lon0,"by",gfs.lon.data[ilon])
print("Approximating latitude",lat0,"by",gfs.lat.data[ilat])
print(ilon, ilat)
Approximating longitude 174.971 by 175.0 Approximating latitude -37.03 by -37.0 700 212
For the last 9 days, download all forecast guidances (cycles 0,6,12 and 18) available and keep the 2 metre temperature variable at the point of interest for the first 6 hours (nowcast).
In [18]:
now = datetime.utcnow()
t = datetime(now.year, now.month, now.day) - relativedelta(days=9)
data = []
files = []
while t < now:
    for cycle in [0,6,12,18]:
        try:
            gfs = xarray.open_dataset('https://nomads.ncep.noaa.gov:9090/dods/gfs_0p25_1hr/gfs%04d%02d%02d/gfs_0p25_1hr_%02dz'%(t.year,t.month,t.day,cycle))
            print(gfs.time[0].data)
            files.append(gfs)
            data.append(gfs.tmp2m[:6,ilat,ilon])

        except:
            pass
t = t + relativedelta(days=1)2020-03-21T00:00:00.000000000 2020-03-21T06:00:00.000000000 2020-03-21T12:00:00.000000000 2020-03-21T18:00:00.000000000 2020-03-22T00:00:00.000000000 2020-03-22T06:00:00.000000000 2020-03-22T12:00:00.000000000 2020-03-22T18:00:00.000000000 2020-03-23T00:00:00.000000000 2020-03-23T06:00:00.000000000 2020-03-23T12:00:00.000000000 2020-03-23T18:00:00.000000000 2020-03-24T00:00:00.000000000 2020-03-24T06:00:00.000000000 2020-03-24T12:00:00.000000000 2020-03-24T18:00:00.000000000 2020-03-25T00:00:00.000000000 2020-03-25T06:00:00.000000000 2020-03-25T12:00:00.000000000 2020-03-25T18:00:00.000000000 2020-03-26T00:00:00.000000000 2020-03-26T06:00:00.000000000 2020-03-26T12:00:00.000000000 2020-03-26T18:00:00.000000000 2020-03-27T00:00:00.000000000 2020-03-27T06:00:00.000000000 2020-03-27T12:00:00.000000000 2020-03-27T18:00:00.000000000 2020-03-28T00:00:00.000000000 2020-03-28T06:00:00.000000000 2020-03-28T12:00:00.000000000 2020-03-28T18:00:00.000000000 2020-03-29T00:00:00.000000000 2020-03-29T06:00:00.000000000 2020-03-29T12:00:00.000000000 2020-03-29T18:00:00.000000000 2020-03-30T00:00:00.000000000 2020-03-30T06:00:00.000000000 2020-03-30T12:00:00.000000000
Concatenate all the 6 hours segments into a single one
In [19]:
nowcast = xarray.concat(data,dim='time')
Now we get all the observation available since the start of the nowcast
In [20]:
t0 = datetime64_to_datetime(nowcast.time[0])
obs = obs_api_connector.get_data(station_id='tu0fknyk',
                                 time=['%04d-%02d-%02d %02d:00:00Z--'%(t0.year, t0.month, t0.day, t0.hour)],
                                 max_nrecords=1000)
As the observation API returns the most recent recoords first, we sort them by ascending time.
In [21]:
obs = obs.sortby('time', ascending=True)Now we match the data. For each observation that has a corresponding time-stamp in the nowcast put data keep the data.
In [22]:
obs_data = []
nowcast_data = []
time = []

## Parse datetime for nowcast
nowcast_time = np.array([datetime64_to_datetime(t) for t in nowcast.time])

for it, t in enumerate(obs.time[:]):
    ## Check if match
    match = np.where(nowcast_time == datetime64_to_datetime(t))
    if len(match[0]) == 1:
        obs_data.append(obs.tmp.data[it])
        nowcast_data.append(nowcast[match[0]].data[0])

        time.append(datetime64_to_datetime(t))

## Turn list into numpy array (nicer to work with)
obs_data =  np.array(obs_data)
## Do also conversion from Kelvin to Celcius
nowcast_data = np.array(nowcast_data)-273.18
time = np.array(time)
Now let's plot the retrieved data. There does not seem to be much if any bias but it looks like the amplitude of the daily variations in the observations is slightly larger than that of the nowcast data so maybe we can correct for that.
In [23]:
%matplotlib inline

plt.plot_date(date2num(time), obs_data, label='Observations')
plt.plot_date(date2num(time), nowcast_data, label='Nowcast')
plt.legend()
Out[23]:
<matplotlib.legend.Legend at 0x14c3112d52b0>

We will have a go at using a simple LSTM model built using Keras with a tensorflow backend. We assume that the image/environment we use here already has CUDA/CUDNN/Tensorflow installed. We just add Keras.
In [28]:
!{sys.executable} -m pip install keras
Collecting keras
  Using cached https://files.pythonhosted.org/packages/ad/fd/6bfe87920d7f4fd475acd28500a42482b6b84479832bdc0fe9e589a60ceb/Keras-2.3.1-py2.py3-none-any.whl
Collecting h5py (from keras)
  Using cached https://files.pythonhosted.org/packages/60/06/cafdd44889200e5438b897388f3075b52a8ef01f28a17366d91de0fa2d05/h5py-2.10.0-cp36-cp36m-manylinux1_x86_64.whl
Collecting keras-preprocessing>=1.0.5 (from keras)
  Using cached https://files.pythonhosted.org/packages/28/6a/8c1f62c37212d9fc441a7e26736df51ce6f0e38455816445471f10da4f0a/Keras_Preprocessing-1.1.0-py2.py3-none-any.whl
Collecting six>=1.9.0 (from keras)
  Using cached https://files.pythonhosted.org/packages/65/eb/1f97cb97bfc2390a276969c6fae16075da282f5058082d4cb10c6c5c1dba/six-1.14.0-py2.py3-none-any.whl
Collecting pyyaml (from keras)
Collecting scipy>=0.14 (from keras)
  Using cached https://files.pythonhosted.org/packages/dc/29/162476fd44203116e7980cfbd9352eef9db37c49445d1fec35509022f6aa/scipy-1.4.1-cp36-cp36m-manylinux1_x86_64.whl
Collecting numpy>=1.9.1 (from keras)
  Using cached https://files.pythonhosted.org/packages/07/08/a549ba8b061005bb629b76adc000f3caaaf881028b963c2e18f811c6edc1/numpy-1.18.2-cp36-cp36m-manylinux1_x86_64.whl
Collecting keras-applications>=1.0.6 (from keras)
  Using cached https://files.pythonhosted.org/packages/71/e3/19762fdfc62877ae9102edf6342d71b28fbfd9dea3d2f96a882ce099b03f/Keras_Applications-1.0.8-py3-none-any.whl
Installing collected packages: six, numpy, h5py, keras-preprocessing, pyyaml, scipy, keras-applications, keras
Successfully installed h5py-2.10.0 keras-2.3.1 keras-applications-1.0.8 keras-preprocessing-1.1.0 numpy-1.18.2 pyyaml-5.3.1 scipy-1.4.1 six-1.14.0
First we prepare the data to model. We will use sequences of the 15 consecutive nowcast points and attempt at predicting the difference between the observations and the nowcast.
In [24]:
x = np.array([nowcast_data[i:i+15] for i in range(len(nowcast_data)-15)])
y = np.array([obs_data[i:i+15][-1]-nowcast_data[i:i+15][-1] for i in range(len(obs_data)-15)])

## Needs to be of shape (nsamples, sequence_length, nfeatures)
x = x.reshape(x.shape[0], x.shape[1], 1)
We normalise the input data to the neural network
In [27]:
xmin = x.min()
xmax = x.max()
x = (x-xmin)/(xmax-xmin)
print(xmin, xmax)
8.8012085 24.061737
Now we load leras and build the model
In [67]:
import keras
from keras.models import Sequential, Model
from keras.layers import Dense, LSTM, Input

neurons = 10
batch_size = 32
nb_epoch = 1000
In [68]:
ip = Input((x.shape[1], x.shape[2]))
xx = LSTM(neurons, stateful=False)(ip)
out = Dense(1)(xx)
model = Model(ip, out)

model.compile(loss='mean_squared_error', optimizer='adam')
We train the model on all data except for the last 50 samples
In [69]:
model.fit(x[:-50], y[:-50], epochs=nb_epoch, batch_size=batch_size, verbose=1, shuffle=False)
Epoch 1/1000
168/168 [==============================] - 0s 2ms/step - loss: 2.5169
Epoch 2/1000
168/168 [==============================] - 0s 114us/step - loss: 2.4623
Epoch 3/1000
168/168 [==============================] - 0s 115us/step - loss: 2.4153
Epoch 4/1000
168/168 [==============================] - 0s 125us/step - loss: 2.3740
Epoch 5/1000
168/168 [==============================] - 0s 101us/step - loss: 2.3374

.....

Epoch 996/1000
168/168 [==============================] - 0s 113us/step - loss: 0.6693
Epoch 997/1000
168/168 [==============================] - 0s 105us/step - loss: 0.6434
Epoch 998/1000
168/168 [==============================] - 0s 128us/step - loss: 0.6387
Epoch 999/1000
168/168 [==============================] - 0s 118us/step - loss: 0.6343
Epoch 1000/1000
168/168 [==============================] - 0s 141us/step - loss: 0.6357
Out[69]:
<keras.callbacks.callbacks.History at 0x14c2c58c0b70>
We evaluate the model on all data
In [70]:
res = model.predict(x).squeeze()
Plotting the data, the model fits the data OK but performs a lot less well on the last 50 time steps which were not in the training set
In [71]:
plt.plot(time[15:], obs_data[15:] - nowcast_data[15:], label='Error')
plt.plot(time[15:], res, label='Correction')
plt.legend()
Out[71]:
<matplotlib.legend.Legend at 0x14c2c4ff0a58>

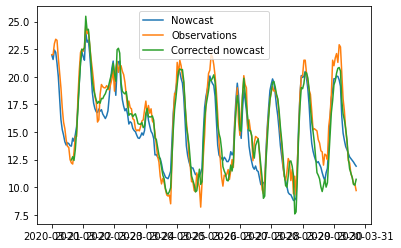
Just for illustration here are the data and the corrected data. The results are not great which is not a surprise but the workflow is there.
In [73]:
plt.plot(time, nowcast_data, label='Nowcast')
plt.plot(time, obs_data, label='Observations')
plt.plot(time[15:], res+nowcast_data[15:], label='Corrected nowcast')
plt.legend()
Out[73]:
<matplotlib.legend.Legend at 0x14c2c4f79668>

In [ ]: